September Economic Indicators Update: International Trade
October 6, 2025Posted by Nathan Book
Each month, the U.S. Census Bureau releases new data on a range of economic indicators, including international trade. These figures capture the flow of goods and services between the United States and the rest of the world, providing insight into global demand for U.S. exports, how American industries are performing abroad, and the nation’s overall trade balance. The figures below come from the latest report, published on September 4, covering data from July 2025.
Exports for the nation totaled $280.5 billion, with $179.4 million of that being exports of goods and the remaining $101.0 billion being exports of services. (Totals do not add up to $280.5 billion due to rounding.)
- This represents an overall increase of $0.8 billion, from the previous month. Though minimal, this increase can largely be attributed to exports of services, which increased by $0.6 billion from June to July.
- This increase resulted in the highest ever monthly total for exports of services at $101.0 billion. Areas that experienced the most growth from June to July include transport (up $0.3 billion) and charges for the use of intellectual property (up $0.2 billion).
- Exports of capital goods reached $59.9 billion, also constituting the highest monthly figure on record. A potential cause for this could be companies’ high investment in new technology, particularly in artificial intelligence, which requires many businesses to invest in new or additional equipment and machinery.
- Other goods and services categories that experienced notable change in exports from the previous month include nonmonetary gold (up $2.9 billion), finished metal shapes (down $2.5 billion), and excavating machinery (down $1.5 billion).
The United States’ imports reached $358.8 billion, consisting of $283.3 billion in goods and $75.5 billion in services.
- A notable increase in imports ($20.0 billion) was evident from June to July, with the majority of this increase being attributable to an increase in imports of goods ($18.3 billion). Much of this increase is the result of businesses seeking to avoid higher reciprocal tariffs before they went into effect with some countries on August 7.
- July’s imports of services were the highest on record, rising $1.7 billion from the previous month and fueled by increased imports in travel (up $0.6 billion) and transport (up $0.6 billion).
- Record high monthly imports were also reached in the categories of capital goods ($96.2 billion) and other goods ($12.8 billion).
- Imports of petroleum ($15.2 billion) fell to their lowest level since April 2021. This is the result of a combination of several factors, including increased global production of petroleum and decreased demand for petroleum products due to an overall economic slowdown, as well as continued geopolitical tension and uncertainty.
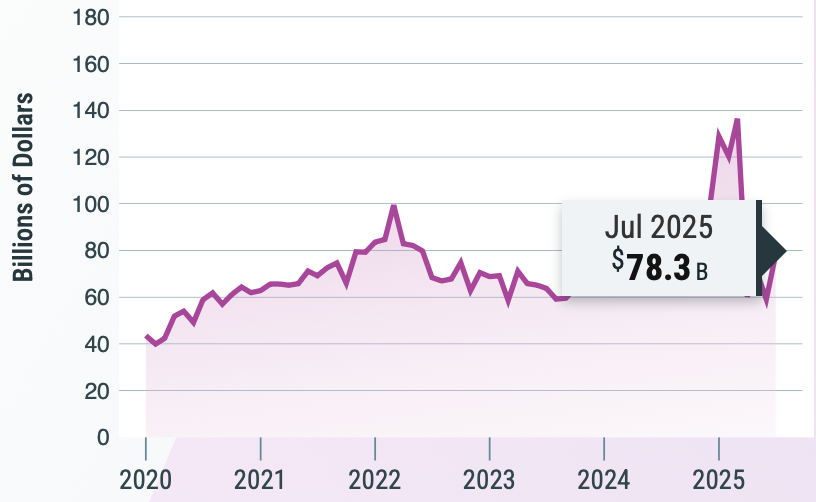
As such, the United States’ current international trade deficit is $78.3 billion, including a deficit of $103.9 billion in goods and a surplus of $25.6 billion in services.
- This deficit is $19.2 billion higher than it was in June, representing an increase of 32.5 percent.
The statistics from July also revealed a combination of trade surpluses and deficits with various countries, demonstrating the United States’ variety of economic relationships with nations around the world.
- The largest trade surpluses were evident with the Netherlands ($4.8 billion), South and Central America ($4.6 billion), and Hong Kong ($1.9 billion).
- Significant deficits were present with Mexico ($16.6 billion), Vietnam ($16.1 billion), China ($14.7 billion), and Taiwan ($13.5 billion). The deficits with Vietnam and Taiwan represented the highest monthly totals ever, fueled by record imports from both nations.
- Exports to Canada for the month of July ($26.1 billion) were the lowest since February 2022 as the trade environment between the two countries becomes increasingly more challenging.
All trade figures are seasonally adjusted and reported in line with international accounting standards to capture the full flow of goods and services across U.S. borders. The next release, featuring data from August, is set for October 7. Ongoing review of these reports supports economic forecasting and helps reveal broader national and global market trends.
U.S. Census Bureau. International Trade. U.S. Department of Commerce. Accessed September 30, 2025. https://www.census.gov/foreign-trade/Press-Release/current_press_release/ft900.pdf