Author: Tina Weyant
November Economic Indicators Update: International Trade
December 5, 2025Posted by Nathan Book
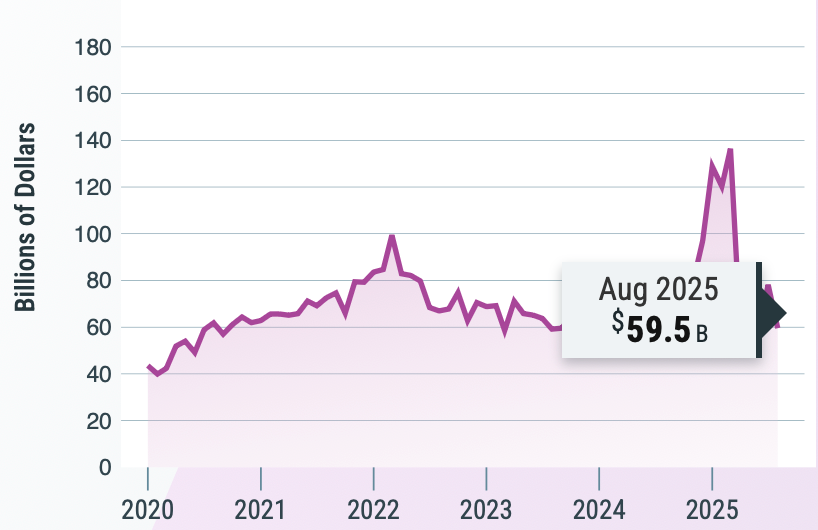
Each month, the U.S. Census Bureau publishes updated economic data, including detailed information on international trade. These updates show how goods and services move between the United States and global markets, offering a snapshot of demand for U.S. products, the performance of American industries overseas, and shifts in the nation’s trade balance. Due to the recent lapse in federal funding, the release of such statistics has been delayed. The figures below are drawn from the most recent release on November 19, reflecting trade activity from August 2025.
Exports for the nation totaled $280.8 billion, with $179.0 million of that being exports of goods and the remaining $101.8 billion being exports of services.
- This represents an overall increase of $0.2 billion from the previous month. This slight increase can be attributed to exports of services, which increased by $0.8 billion from July to August.
- This increase resulted in the highest ever monthly total for exports of services at $101.8 billion. Areas that experienced the most growth from July to August include travel (up $0.3 billion), maintenance and repair services (up $0.2 billion) and charges for the use of intellectual property (also up $0.2 billion).
- Exports of capital goods reached $62.4 billion, also constituting the highest monthly figure on record, after reaching a previous high in July. This figure was boosted by a notable increase in exports of computers (up $2.3 billion) as companies continue to invest in new technology and increase their utilization of artificial intelligence.
- Other goods and services categories that experienced notable change in exports from the previous month include pharmaceutical preparations (down $1.2 billion) and nonmonetary gold (down $1.1 billion).
The United States’ imports reached $340.4 billion, consisting of $264.6 billion in goods and $75.8 billion in services.
- Contrasting the trend from June to July, imports experienced a notable decrease ($18.4 billion) from July to August. This was primarily due to a $18.6 billion decrease in imports of goods, likely due to the effects of tariffs, as well as decreases in consumer demand in some areas.
- Imports of services for August were the highest monthly total on record, rising $0.3 billion from July and fueled by $0.1 billion increases in three categories: other business services, travel, and telecommunications, computer, and information services.
- Record high monthly totals were also reached with imports of other goods ($13.6 billion).
- Imports of consumer goods ($55.1 billion) fell to their lowest level since July 2020. This is likely due to the continued implementation of tariffs, as well as both businesses and consumers responding to price increases and associated economic uncertainty.
As such, the United States’ current international trade deficit is $59.6 billion, including a deficit of $85.6 billion in goods and a surplus of $26.1 billion in services.
- This deficit is $18.6 billion lower than it was in June, representing a decrease of 23.8 percent. The goods deficit was also the lowest monthly figure since September 2023.
The statistics from July also showed a combination of trade surpluses and deficits with various countries, demonstrating the varied nature of the United States’ economic relationships with other nations.
- The largest trade surpluses were evident with the Netherlands ($5.1 billion), South and Central America ($4.9 billion), and Hong Kong ($1.7 billion).
- Significant deficits were present with Mexico ($16.3 billion), China ($15.4 billion), Vietnam ($14.4 billion) and Taiwan ($12.2 billion).
- Imports from Canada for the month of August ($29.4 billion) were the lowest since May 2021 as the trade environment between the two countries becomes increasingly more challenging.
All trade figures are seasonally adjusted and reported in line with international accounting standards to capture the full flow of goods and services across U.S. borders. The date for the next release, featuring data from September, has not yet been named, but will be established in coordination with other federal agencies to adequately address the effects of the recent federal funding lapse.
U.S. Census Bureau. International Trade. U.S. Department of Commerce. Accessed December 2, 2025. https://www.census.gov/foreign-trade/Press-Release/current_press_release/ft900.pdf
2025 Manufacturers’ Expo
November 7, 2025Posted by Nathan Book
On November 5, 2025, the Manufacturers’ Association hosted the annual Manufacturers’ Expo at UPMC Arena at the York Fairgrounds. As the only trade show in south-central Pennsylvania dedicated solely to manufacturing, the event brought together manufacturers and related organizations to connect with each other, exhibit their products and capabilities, and grow their respective businesses. This year’s trade show, MX2025, was the fifth edition of the event and featured over 120 exhibitors and nearly 1,000 attendees, including a variety of manufacturers located in the south-central PA region.
The event also featured both morning and afternoon keynotes, each of which addressed pertinent topics in the manufacturing industry. The morning keynote focused on the adoption of AI in a variety of roles and businesses in manufacturing, emphasizing how the increasing prominence of AI necessitates both effective integration of AI platforms and responsible utilization of such tools to protect company safety and security. Furthermore, the afternoon keynote explored the role of the United States’ industrial base, sharing the U.S. Navy’s ongoing efforts to support and expand the nation’s manufacturing capacity. The following individuals were featured as speakers at the event:
- Adam Marsh: President, Ledge, Inc. (Morning Keynote)
- Ed “Kingfish” Lada, Jr.: President & CEO, Goodwill Keystone Area (Morning Keynote)
- Andy Kochanowski, PhD: Founder & CEO, Alerify (Morning Keynote)
- Josh Sturgill: Workforce Development – U.S. Navy’s Maritime Industrial Base Program (Afternoon Keynote)
The 2025 Manufacturers’ Expo highlighted the strength and innovation of south-central Pennsylvania’s manufacturing community, offering valuable opportunities for networking, learning, and collaboration among industry professionals. From insightful keynote sessions to interactive exhibits, MX2025 provided a platform for sharing new technologies, discussing emerging challenges, and celebrating the growth of the regional industrial sector. Attendees left with fresh perspectives on the future of manufacturing and a renewed commitment to advancing their businesses and the broader community. A full description of the event, including a complete list of sponsors and exhibitors, can be found here.
September Economic Indicators Update: International Trade
October 6, 2025Posted by Nathan Book
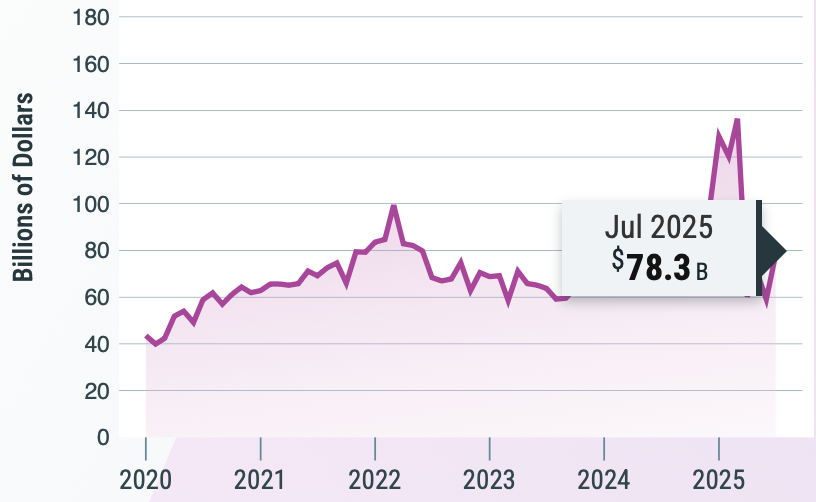
Each month, the U.S. Census Bureau releases new data on a range of economic indicators, including international trade. These figures capture the flow of goods and services between the United States and the rest of the world, providing insight into global demand for U.S. exports, how American industries are performing abroad, and the nation’s overall trade balance. The figures below come from the latest report, published on September 4, covering data from July 2025.
Exports for the nation totaled $280.5 billion, with $179.4 million of that being exports of goods and the remaining $101.0 billion being exports of services. (Totals do not add up to $280.5 billion due to rounding.)
- This represents an overall increase of $0.8 billion, from the previous month. Though minimal, this increase can largely be attributed to exports of services, which increased by $0.6 billion from June to July.
- This increase resulted in the highest ever monthly total for exports of services at $101.0 billion. Areas that experienced the most growth from June to July include transport (up $0.3 billion) and charges for the use of intellectual property (up $0.2 billion).
- Exports of capital goods reached $59.9 billion, also constituting the highest monthly figure on record. A potential cause for this could be companies’ high investment in new technology, particularly in artificial intelligence, which requires many businesses to invest in new or additional equipment and machinery.
- Other goods and services categories that experienced notable change in exports from the previous month include nonmonetary gold (up $2.9 billion), finished metal shapes (down $2.5 billion), and excavating machinery (down $1.5 billion).
The United States’ imports reached $358.8 billion, consisting of $283.3 billion in goods and $75.5 billion in services.
- A notable increase in imports ($20.0 billion) was evident from June to July, with the majority of this increase being attributable to an increase in imports of goods ($18.3 billion). Much of this increase is the result of businesses seeking to avoid higher reciprocal tariffs before they went into effect with some countries on August 7.
- July’s imports of services were the highest on record, rising $1.7 billion from the previous month and fueled by increased imports in travel (up $0.6 billion) and transport (up $0.6 billion).
- Record high monthly imports were also reached in the categories of capital goods ($96.2 billion) and other goods ($12.8 billion).
- Imports of petroleum ($15.2 billion) fell to their lowest level since April 2021. This is the result of a combination of several factors, including increased global production of petroleum and decreased demand for petroleum products due to an overall economic slowdown, as well as continued geopolitical tension and uncertainty.
As such, the United States’ current international trade deficit is $78.3 billion, including a deficit of $103.9 billion in goods and a surplus of $25.6 billion in services.
- This deficit is $19.2 billion higher than it was in June, representing an increase of 32.5 percent.
The statistics from July also revealed a combination of trade surpluses and deficits with various countries, demonstrating the United States’ variety of economic relationships with nations around the world.
- The largest trade surpluses were evident with the Netherlands ($4.8 billion), South and Central America ($4.6 billion), and Hong Kong ($1.9 billion).
- Significant deficits were present with Mexico ($16.6 billion), Vietnam ($16.1 billion), China ($14.7 billion), and Taiwan ($13.5 billion). The deficits with Vietnam and Taiwan represented the highest monthly totals ever, fueled by record imports from both nations.
- Exports to Canada for the month of July ($26.1 billion) were the lowest since February 2022 as the trade environment between the two countries becomes increasingly more challenging.
All trade figures are seasonally adjusted and reported in line with international accounting standards to capture the full flow of goods and services across U.S. borders. The next release, featuring data from August, is set for October 7. Ongoing review of these reports supports economic forecasting and helps reveal broader national and global market trends.
U.S. Census Bureau. International Trade. U.S. Department of Commerce. Accessed September 30, 2025. https://www.census.gov/foreign-trade/Press-Release/current_press_release/ft900.pdf

Bringing the World to PA 2025
September 16, 2025Posted by Nathan Book
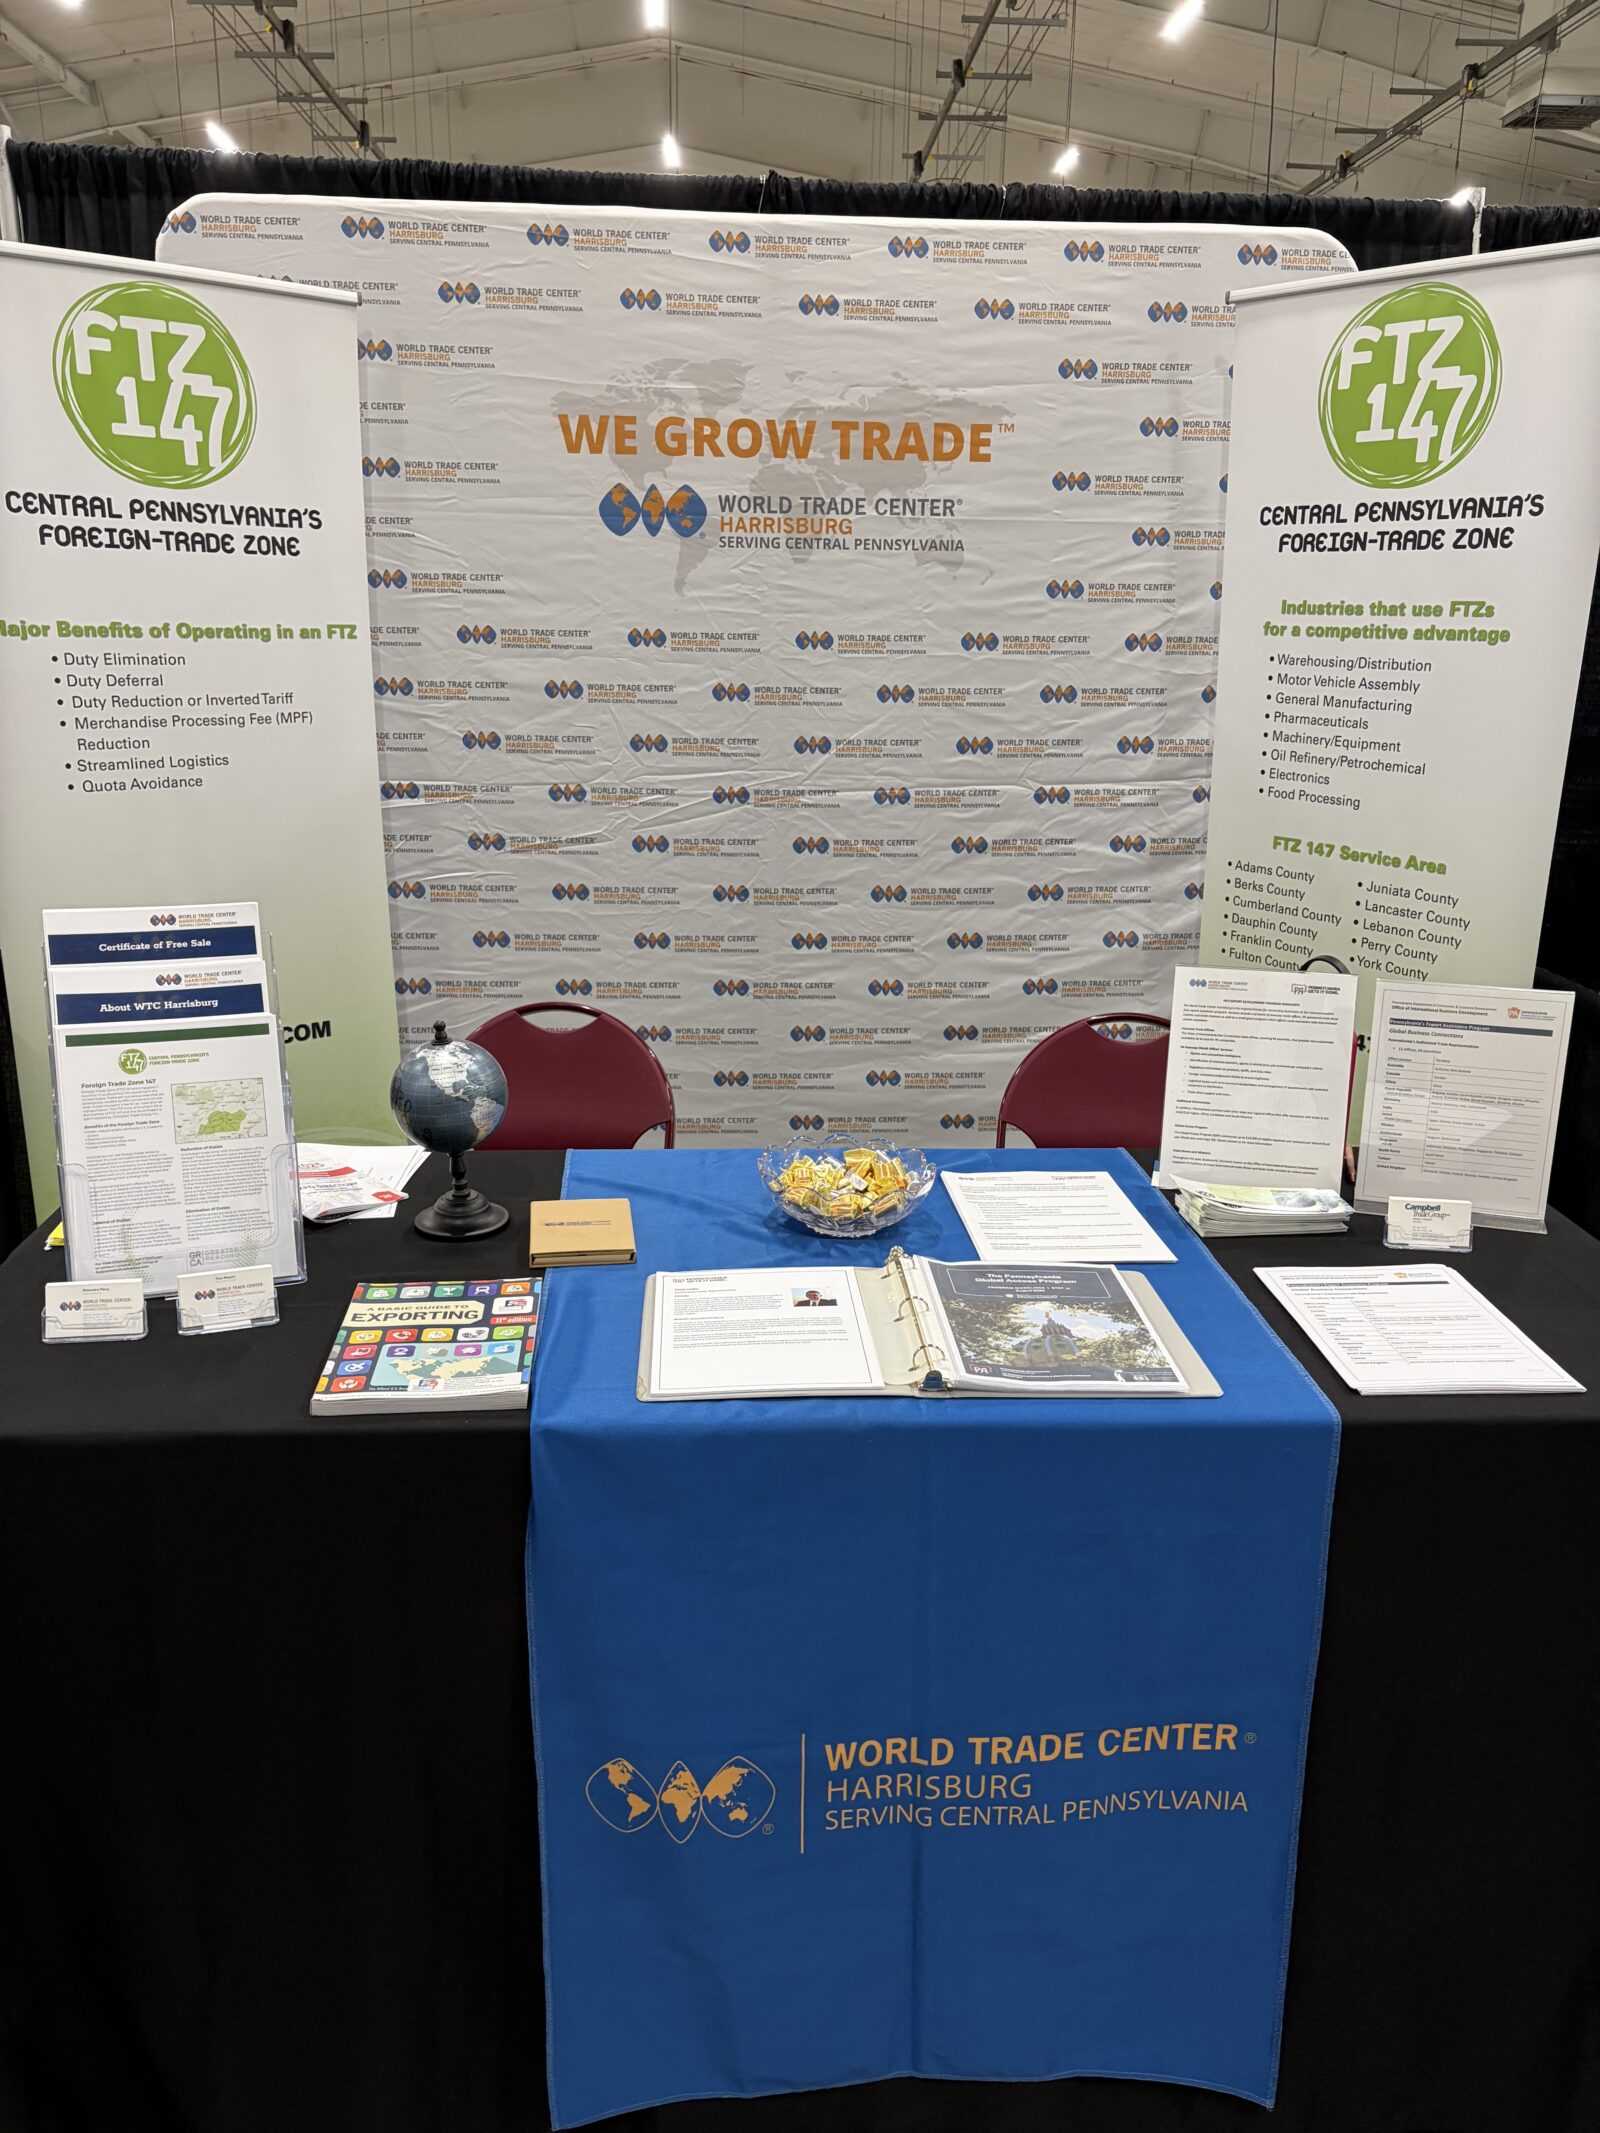
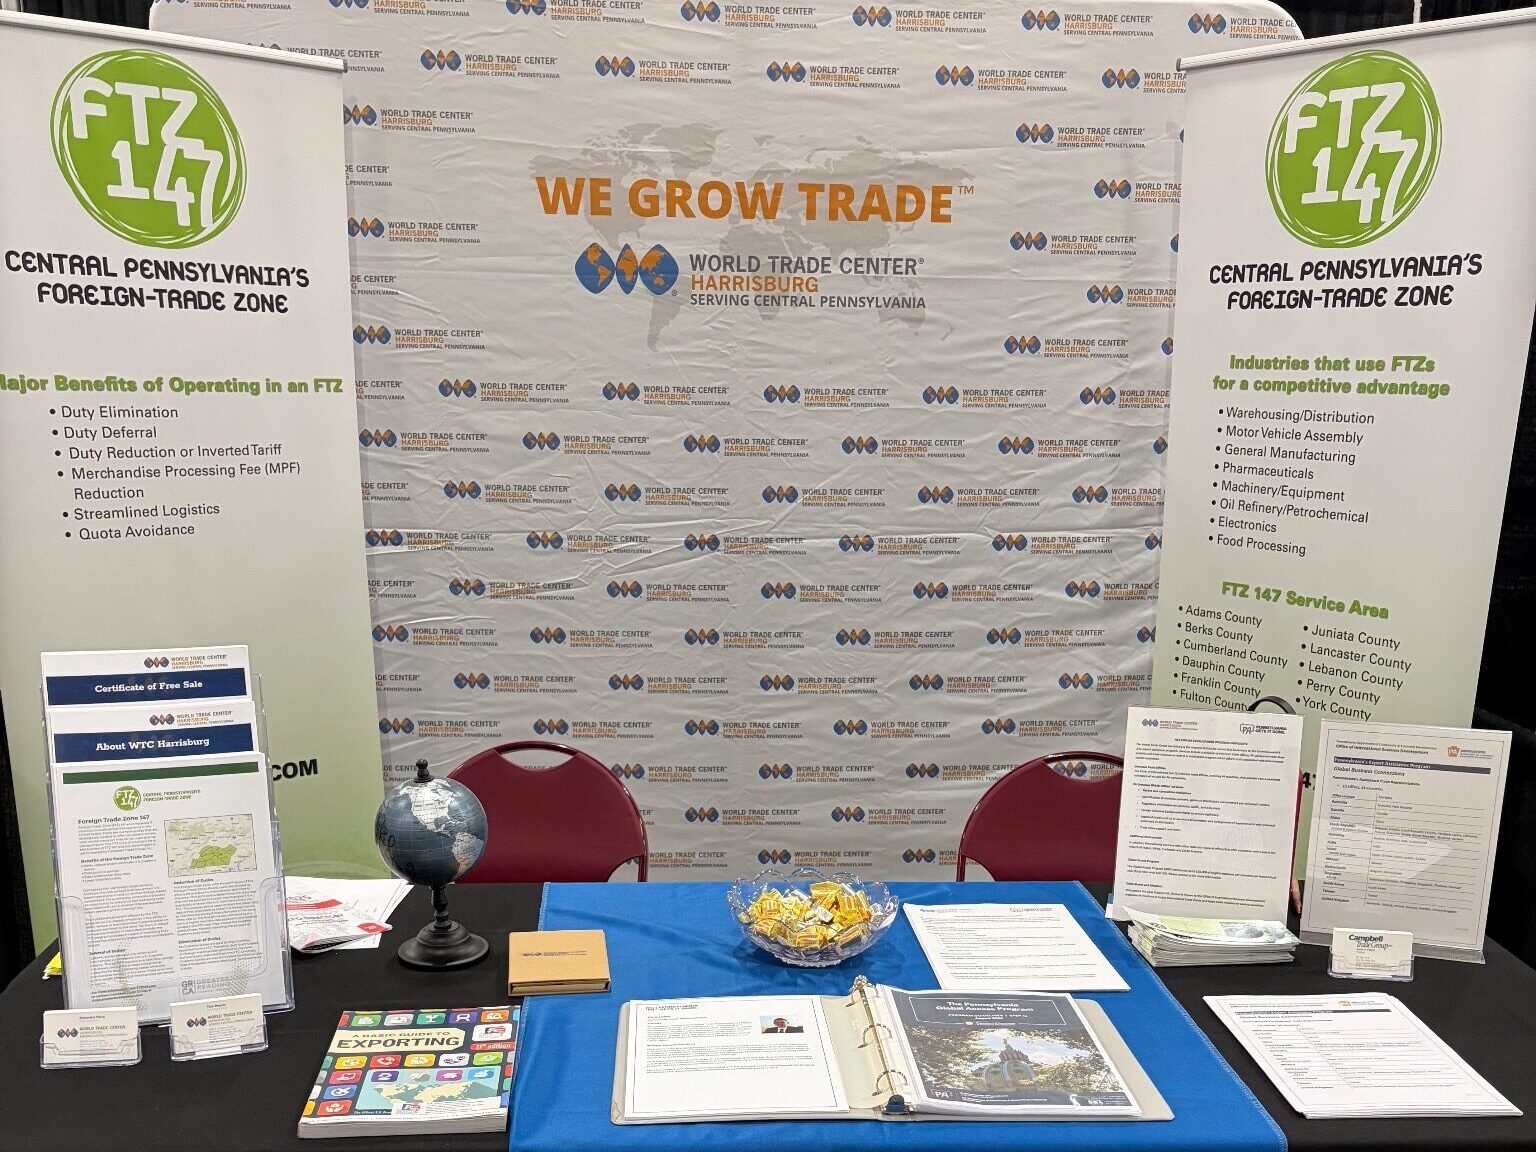
On September 10, BusinessPA and World Trade Center Harrisburg hosted Bringing the World to Pennsylvania at the AACA Museum in Hershey. The annual event was one of ten stops held across the state from September 8–19, which connects local companies with the state’s network of Authorized Trade Representatives (ATRs) around the world. These ATRs work alongside Pennsylvania’s Regional Export Network (REN), which exists as PA’s in-state network of trade experts across 10 geographic regions, one of which is served by World Trade Center Harrisburg. Covering 44 countries worldwide, these 13 ATRs serve as Pennsylvania’s in-country experts, providing on-the-ground insight into market conditions, regulatory requirements, cultural considerations, and opportunities for companies looking to expand abroad. Their visit to Pennsylvania each fall gives businesses across the state the unique chance to meet face-to-face with these international trade professionals without leaving their home regions, making global expansion and investment from abroad possible and accessible to companies of all sizes.
This year’s event in Hershey brought together ATRs from markets across Europe, Asia, Oceania, the Middle East, and the Americas, as well as a diverse mix of southcentral Pennsylvania companies ranging from manufacturers to service providers. Throughout the day, companies met individually with ATRs to discuss export strategies, market-entry plans, and opportunities to grow their global presence. These one-on-one consultations were complemented by networking opportunities with peers and trade professionals, as well as a keynote address that underscored the importance of international trade to the economic vitality of both southcentral Pennsylvania and the U.S. as a whole.


The keynote address was delivered by David L. Cohen, who served as the U.S. ambassador to Canada during the Biden administration. Cohen’s speech was entitled “State of International Trade in Trump Administration Ⅱ” and shared both his experience working as U.S. ambassador to Canada and his insights regarding the current policy environment in the nation and their impacts on both the United States’ relationship with Canada and on its economy as a whole. He discussed the multifaceted role ambassadors play in managing geopolitical relationships and detailed Trump’s tariff announcements and their potential economic impacts, in addition to sharing how tariffs combined with spending cuts and tax hikes constitute the largest redistribution of wealth in American history. In spite of changes in priorities and policies between administrations, Cohen reiterated that what remains constant is Canada’s close economic ties with the United States, and more specifically, Pennsylvania.
By showcasing local companies and connecting them directly with Pennsylvania’s global representatives, Bringing the World to Pennsylvania highlighted the state’s commitment to supporting exporters, attracting foreign investment, and strengthening the state’s role in the international marketplace. In total, around 97 meetings took place between south-central PA businesses and ATRs, resulting in 24 work orders that demonstrate tangible export activity or international exchange. The event not only reinforced the value of international engagement for businesses seeking growth but also demonstrated how state-level resources can help companies overcome barriers to entering foreign markets. Looking ahead, the insights shared and connections forged during the event will continue to shape the region’s participation in the global economy.
We sincerely thank our sponsors and partners for their generous support of this event:
FTZ 147/Berks County Chamber of Commerce
Fulton Bank International Group
BusinessPA
US Commercial Service Harrisburg
MANTEC
July Economic Indicators Update: International Trade
July 9, 2025Posted By Nathan Book
Each month, the U.S. Census Bureau publishes updated figures on numerous economic indicators, including those related to international trade. This data tracks the movement of goods and services into and out of the United States, offering a glimpse into global demand for American exports, the performance of domestic industries in global markets, and the nation’s overall trade balance. The statistics shared below appeared in the most recent report, dated July 3, which shared data from May 2025.
Exports for the nation totaled $279.0 billion, with $180.2 million of that being comprised of goods and the remaining $98.8 billion being imports of services.
- This represents an overall decrease of $11.6 billion, or around 4 percent, from the previous month, which can be attributed to a $10.8 billion decline in exports of goods.
- Petroleum exports ($19.0 billion) were the lowest since October 2021 as oil prices fell due to economic uncertainties resulting from new and anticipated U.S. tariffs. With oil production being less profitable due to these low prices, the U.S. produced and therefore exported less oil during the month of May.
- The broader category of industrial supplies and materials also experienced a decrease in exports, dropping $10.0 billion from April to May. This drop can largely be credited to a $5.5 billion decline in exports of nonmonetary gold.
- Exports of consumer goods ($22.4 billion) reached their highest point since March 2023, driven by a $1.1 billion increase in exports of pharmaceutical preparations from April to May. However, some of this high export value may be due to a temporary surge in exports as some businesses anticipate supply chain disruptions, increased input costs, or reduced demand due to tariffs.
The United States’ imports reached $350.5 billion, consisting of $277.7 billion in goods and $72.8 billion in services.
- A slight decline in imports ($0.3 billion) was evident from April to May, with both goods ($0.2 billion) and services ($0.1 billion) experiencing comparatively minor decreases in terms of their imports.
- Imports of industrial supplies and materials fell $0.9 billion from April to $51.1 billion, the lowest value since April 2021. This is somewhat due to decreases in imports of finished metal shapes, but can primarily be attributed to U.S. tariffs weighing on trade. This is particularly evident with industrial materials, which saw their imports largely front-loaded in anticipation of tariffs, resulting in a sharp plummet in May once tariffs came more into effect.
- Although most goods and services experienced a decrease in imports, some saw their imports rise from April to May, including passenger cars ($3.1 billion), computers ($4.4 billion), and nuclear fuel materials ($0.6 billion).
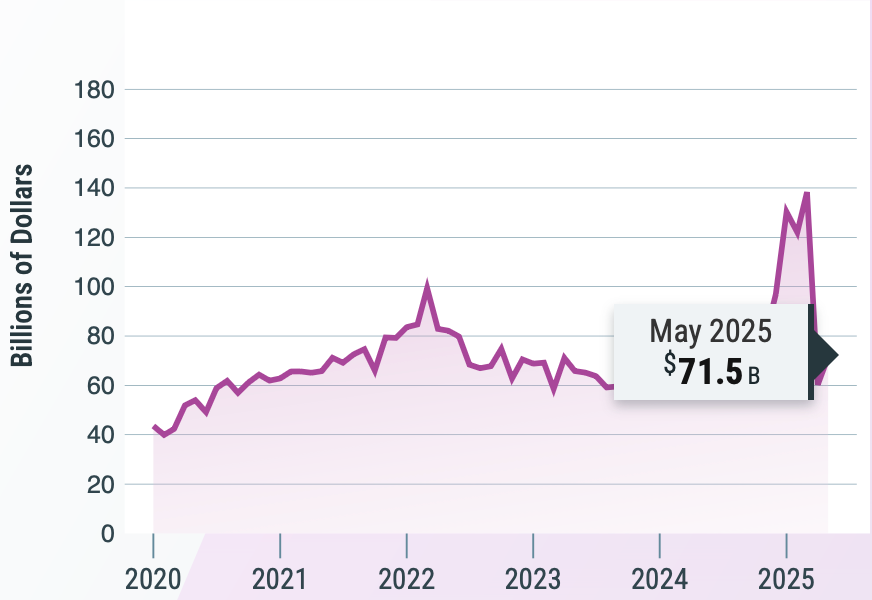
As such, the United States’ current international trade deficit is $71.5 billion, including a deficit of $97.5 billion in goods and a surplus of $26.0 billion in services.
- This deficit is $11.3 billion higher than it was in April, representing an increase of 18.7 percent, although it is worth noting that April’s trade deficit was the lowest since September 2023.
The statistics from May also demonstrated a combination of trade surpluses and deficits with various countries, reflecting the varied nature of the United States’ economic relationships with other nations.
- The largest trade surpluses were evident with the Netherlands ($4.8 billion), Hong Kong ($3.6 billion), South and Central America ($3.3 billion), and Switzerland ($3.3 billion). The May surplus with Switzerland was the highest ever recorded.
- Significant deficits were present with the European Union ($22.5 billion), Mexico ($17.1 billion), Vietnam ($14.9 billion), and China ($14.0 billion). The deficit with Vietnam, as well as that with Taiwan ($11.5 billion) and Thailand ($5.2 billion), were the highest on record.
- Notably, the U.S. trade deficit with China narrowed by $5.7 billion from April to May, fueled by a $7.4 billion decrease in U.S. imports of Chinese goods and services.
All trade data is seasonally adjusted and follows international accounting standards to show the complete movement of goods and services across U.S. borders. The upcoming release, which will present June’s statistics, is scheduled for August 5. Regular analysis of these reports aids in forecasting efforts and provides insight into both national economic conditions and global market trends.
U.S. Census Bureau. International Trade. U.S. Department of Commerce. Accessed July 8, 2025. https://www.census.gov/foreign-trade/Press-Release/current_press_release/ft900.pdf
June Economic Indicators Update: International Trade
July 8, 2025Posted by Nathan Book
Each month, the U.S. Census Bureau releases national data on a variety of key economic indicators. Among these figures are several pertaining to international trade, measuring the flow of goods and services across U.S. borders. These statistics provide insights into global demand for American products, the competitiveness of U.S. industries, and the balance between what the nation sells abroad and what it buys from other countries. The following statistics were present in the most recent report, dated June 5, which shared data from April 2025:
- U.S. exports totaled $289.4 billion, with $190.5 billion being comprised of exports of goods and the remaining $98.9 billion in services exports.
- Exports of goods increased ($6.2 billion) from the previous month, fueled by a surge in exports of industrial supplies and materials.
- Exports of services experienced also increased ($2.1 billion) from March to April. The primary contributor to this increase was a rise in the export of travel services.
- Imports for the nation reached $351.0 billion. Among these imports were $277.9 billion in goods and $73.1 billion in services.
- Imports of goods experienced a notable decrease ($68.9 million) from the previous month, with decreases evident in all categories. Representing the largest ever monthly drop, this is largely a result of a surge in imports in March to avoid tariffs, followed by a pullback in April and businesses and consumers adjusted to new tariff policies.
- Imports of services also experienced a minimal increase ($0.5 billion) due to slightly higher imports of travel and other business services.
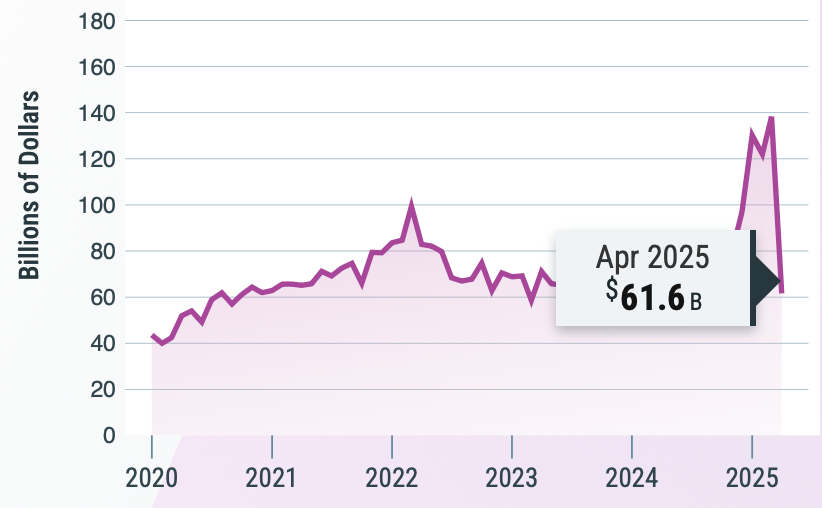
- As such, the United States’ current international trade deficit in goods and services is $61.6 billion, down $76.7 billion from March. This massive decrease can be attributed to a significant decrease in the imports of goods, brought upon by new and anticipated tariff policies. As shown by the graph below, this represents the nation’s lowest trade deficit since September 2023.
- With regard to trade with specific countries, the April statistics revealed a combination of surpluses and deficits, reflecting the varied nature of U.S. economic relationships around the world:
- Notable trade surpluses were recorded with Hong Kong ($6.9 billion), Netherlands ($4.8 billion), United Kingdom ($4.3 billion), and Switzerland ($3.5 billion).
- Deficits persisted with many key nations and regions, including China ($19.7 billion), the European Union ($17.9 billion), Vietnam ($14.5 billion), and Mexico ($13.5 billion).
All trade figures are adjusted to remove typical seasonal fluctuations and are reported using international accounting standards that track the full flow of goods and services between countries. The next iteration of data regarding these indicators, representing statistics from May, will be released on July 3. Monitoring these monthly statistics assists in the anticipation of market trends and prediction of performance in both domestic and global markets.
U.S. Census Bureau. International Trade. U.S. Department of Commerce. Accessed June 10, 2025. https://www.census.gov/foreign-trade/Press-Release/current_press_release/ft900.pdf

2025 Summer Fancy Food Show
July 3, 2025Posted by Nathan Book
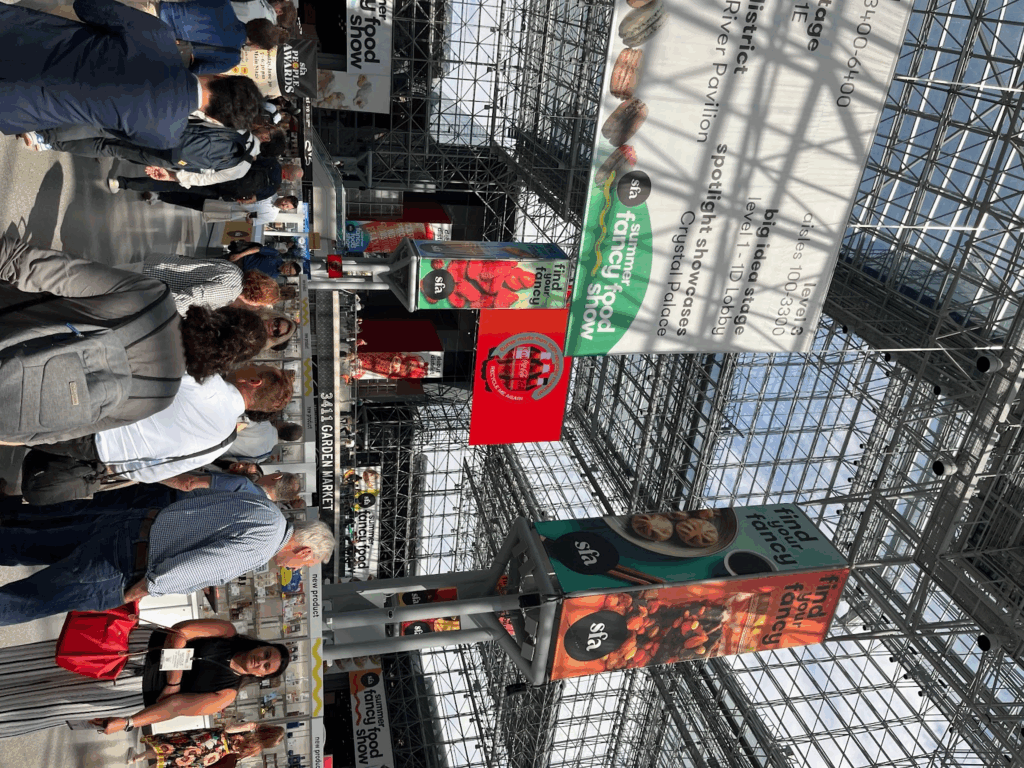
From June 29 to July 1, the Javits Center in New York City hosted the 2025 Summer Fancy Food Show, one of the largest trade shows in the specialty food industry. Organized annually by the Specialty Food Association, the event offers producers and brands a valuable platform to showcase their products, connect with buyers, distributors, and other key stakeholders in the industry, and gain vital exposure needed to grow their businesses. In doing so, the Summer Fancy Food Show provides insight into both consumer values and preferences and emerging trends in the food industry, as evidenced by the wide variety of products showcased at the event.
The 2025 Summer Fancy Food Show brought together nearly 2,500 exhibitors and over 30,000 attendees from more than 100 countries, contributing to a dynamic, vibrant, and energetic atmosphere. From the moment the doors opened at the Javits Center, the show buzzed with activity, with prospective buyers sampling new products, sellers sharing their stories, and companies making valuable connections that could shape their future business growth. The sheer scale of the event made it an epicenter for innovation, conversation, and opportunity across the global specialty food industry.
Beyond its scope, the event showcased a diverse assortment of specialty foods and beverages from across the United States and around the world. Exhibitors ranged from well-established companies to smaller-scale businesses, each bringing unique flavors, stories, and products to the show floor. Many of these innovative products aligned with leading and emerging trends shaping the food industry, including:
- The rise of “flexible snacking” products, representing higher-quality foods with nuanced flavors that consumers can enjoy as either meals or snacks
- Increased globalization of foods resulting from rising consumer demand for new tastes and authentic, regional foods from non-native areas
- Interest in restaurant-quality home cooking, fueled by gourmet foods, ingredients, and convenient meal kits readily available for at-home chefs
- The growth of personalized nutrition products that support wellness, namely customizable product lines and functional foods with tangible health benefits
- Continued expansion of diet-specific food offerings, such as plant-based and vegan, reflecting both dietary shifts and an increased focus on sustainability
Pennsylvania made a strong impression at this year’s show, with over 60 companies participating, 14 of which were featured in the Pennsylvania pavilion. These companies represented a broad array of product categories, ranging from meat to snacks to condiments, showcasing Pennsylvania’s tremendous diversity in food production and underscoring the state’s growing influence in domestic and international food markets. The Pennsylvania pavilion created a unified presence that made it easy for attendees to engage with multiple local producers in one space, with the centralized location elevating the state’s visibility at the event and prompting a great deal of foot traffic and interest.
The World Trade Center Harrisburg was also present at the Summer Fancy Food Show, maintaining a booth within the Pennsylvania pavilion to assist participating exhibitors and provide information to those present regarding available services and opportunities related to international trade. Several companies from the southcentral PA region covered by the World Trade Center Harrisburg participated in the show, including these exhibitors present in the Pennsylvania pavilion:
- Dilly Artisan Foods (Lancaster): offers handcrafted, locally sourced cup cheese made with a deep commitment to supporting local farmers and artisans
- Painterland Sisters (Lititz): produces high-protein, probiotic-rich, Icelandic-style skyr yogurt on their fourth-generation PA dairy farm
- Taylor Chip (Gordonville): a family-owned cookie company providing a wide range of cookie flavors made with simple, wholesome ingredients
As an intern, participating in the 2025 Summer Fancy Food Show gave me a firsthand look at how trade shows help companies of all sizes expand their reach, especially internationally. I gained insight into the logistics of show preparation, exhibitor support, and the importance of networking and building relationships face-to-face. The experience also reiterated to me how global the food industry truly is, representing a significant opportunity for Pennsylvania companies seeking to expand the scope and reach of their products. I was inspired by the dedication of our state’s companies to quality and innovation and was struck by how many of them are family-run or smaller in size but yet are stepping confidently onto the global stage. As such, seeing companies in our state connect with prospective domestic and international buyers gave me additional appreciation for the value of export readiness and the role organizations like the World Trade Center Harrisburg play in supporting these efforts.
Opportunities such as the Summer Fancy Food Show are invaluable in elevating local companies on the international stage and connecting them with the support, resources, and partnerships necessary to grow their businesses. The World Trade Center Harrisburg is available to assist companies in the southcentral PA region with their international trade endeavors, offering services such as market research, trade show support, educational programs, and connections to global partners and government programs that help businesses succeed in international markets. For more information about these services and offerings, including next year’s Summer Fancy Food Show, visit the World Trade Center Harrisburg’s website here or contact a member of our staff.
What I’ve Learned: Harmonized Tariff Schedule
June 23, 2025Posted by Nathan Book
The Harmonized Tariff Schedule (HTS) establishes the tariff rates and statistical classifications for all goods imported into the United States. The HTS is based on the international Harmonized System (HS), which is the global naming system applied to most world trade in goods. Published by the United States International Trade Commission (ITC), the HTS is fully available online and can be accessed here.
Within the HTS, general rules of interpretation, section outlines, and chapter notes exist to aid users in understanding and interpreting tariff classifications. General rules of interpretation delineate foundational rules used to classify goods and consist of six rules that must be followed in order to ensure consistency and compliance with the HS system. Section outlines then group related chapters into broad categories based on product type, providing a high-level overview of the goods covered by each section. Moreover, the chapter notes provide more detailed legal definitions and rules pertaining to classification of goods. Since the chapter notes hold legal weight in that goods cannot be classified without consulting them, referencing the chapter notes is an essential step in reviewing any goods within the HTS.
In order to maintain a streamlined system of categorization, each traded good is also assigned a ten-digit HTS code. While the first six digits of HTS codes align with the international HS codes, the United States adds four additional digits for more detailed classification and statistical reporting, as well as the determination of tariff rates. With the latter being particularly relevant in today’s trade environment, understanding such rates is imperative.
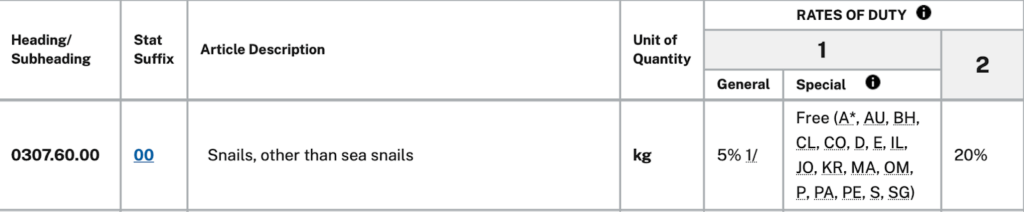
The tariff section of the HTS contains three primary columns. The definitions of each column reference the image below, which contains details from the HTS for the good “snails, other than sea snails,” with an HTS code of 0307.60.00.00.
- Column 1– General: This is the standard duty rate applied to imports from countries with which the United States maintains normal trade relations. Thus, the imports of many U.S. trading partners, such as Canada, Mexico, and Japan, would be subject to a 5% duty on snails.
- Column 1– Special: This section provides a reduced or duty-free rate, if applicable, utilized by countries that have a free trade agreement or preferential trade program with the United States. With the example of snails, imports from countries named within the listed abbreviations would not be subject to any duties.
- Column 2: This duty rate applies to a select few countries, such as Cuba and North Korea, that do not have normal trade relations with the United States. Imports from these countries are subject to much higher duty rates, such as the 20% rate shown below on imports of snails.
Although keeping up with the HTS can seem challenging at times due to its vast and ever-changing nature, doing so is not an insurmountable task. During my internship at the World Trade Center Harrisburg, I have gained valuable insight into the structure and interpretation of the HTS. Below is a summary of key tips and takeaways I have developed through this experience:
- Review the general rules of interpretation. As the legal foundation for classifying goods under the HTS, they provide essential guidance on how to interpret chapter headings, subheadings, and notes. These rules must be followed in order to ensure accurate and consistent classification and interpretation, and I have found that reviewing these prior to looking at product codes makes the process much easier and more efficient.
- Utilize the chapter notes. These contain more detailed definitions, inclusions, and exclusions for specific goods, providing needed clarification during the classification process. Since correctly determining the exact classification of a product is a necessary step in finding the relevant duty rate for a given import, chapter notes must always be referenced in tandem with the HTS during this step.
- View past rulings. Consulting binding rulings issued by U.S. Customs and Border Protection (CBP) can provide helpful precedent when classifying goods. Offering insight as to how CBP has previously interpreted similar products, such rulings can be viewed using the Customs Rulings Online Search System (CROSS) here or by clicking on the stat suffix for a given good in the online version of the HTS.
- Compare similar products. Another simple way to determine the correct HTS code for a given good is to look through the HTS for similar products to reveal patterns in classification logic. I have noticed that distinctions between products are often subtle, but can be highly significant when it comes to duty rates, making careful comparison and discernment a necessity.
- Complete the interactive HTS training. The U.S. ITC offers self-paced online training modules on how to understand and use the HTS here at no cost. I found completing this training to be beneficial, providing me with foundational knowledge allowing me to gain confidence using the HTS.
By applying these strategies, I have found that navigating the HTS becomes much more effective and intuitive. A solid understanding of its structure and supporting resources not only enhances classification accuracy, but also supports more informed trade decisions. Although international trade is inherently complex and involves numerous systems and guidelines, effectively utilizing available resources like the HTS can simplify the process considerably.
Foreign Direct Investment in Pennsylvania
June 12, 2025Posted by Nathan Book
Foreign direct investment (FDI) refers to investments made by companies or individuals of one country into business interests in another country. This can include opening new facilities, acquiring existing businesses, or reinvesting earnings from foreign operations, all of which serve the purpose of establishing a lasting interest in the management of the foreign enterprise. FDI not only benefits the investor, providing access to new markets, lower costs, and increased profits, but also stimulates economic development in the host country, bringing in capital, technology, and access to global markets while simultaneously creating new jobs.
Consequently, FDI plays a key role in Pennsylvania, strengthening both the state’s economy and its workforce. Demonstrating a firm commitment to this purpose, Pennsylvania’s Office of International Business Development (OIBD), a division of BusinessPA, actively works to attract foreign investors and support the success of global companies operating in the state. As part of this mission, OIBD provides a variety of resources and information to assist parties interested in FDI and connect them with available programs, solutions, and funding opportunities. This information includes the following facts regarding FDI in Pennsylvania, emphasizing its significant impact in the state:
- Pennsylvania’s GDP is $965 billion, comparable to that of the Netherlands and larger than countries like Switzerland and Turkey
- There are around 7,300 foreign-owned firms operating in the state
- Over 436,000 Pennsylvania workers are employed by foreign-owned firms
- The top countries investing in the state include the United Kingdom, Germany, Canada, France, and Japan
The vast extent of FDI in Pennsylvania is further evidenced by data regarding the number of foreign-owned firms and employment in the state. Such information was compiled from OIBD’s country fact sheets, which further demonstrate the business connections between Pennsylvania and thirty-one key countries that do business there. The fact sheets, which contain the data below pertaining to total and manufacturing FDI, can be found here.
*Data represents a minimum of 50% foreign ownership. The total number of firms may include multiple locations, but excludes retail establishments.
Total Foreign-Owned Firms in Pennsylvania by Country and their Employees, 2023
| Country | # of Firms | Country | # of Jobs | |||||
| 1 | United Kingdom | 856 | 1 | United Kingdom | 54,316 | |||
| 2 | Germany | 744 | 2 | France | 48,191 | |||
| 3 | Canada | 637 | 3 | Germany | 37,289 | |||
| 4 | France | 481 | 4 | Canada | 33,725 | |||
| 5 | Japan | 468 | 5 | Switzerland | 22,980 | |||
| 6 | Ireland | 382 | 6 | Japan | 21,402 | |||
| 7 | Switzerland | 357 | 7 | Netherlands | 20,383 | |||
| 8 | Netherlands | 206 | 8 | Ireland | 16,719 | |||
| 9 | Luxembourg | 157 | 9 | Mexico | 16,689 | |||
| 10 | Australia | 142 | 10 | Luxembourg | 14,909 |
Foreign-Owned Manufacturing Firms in Pennsylvania by Country and their Employees, 2023
| Country | # of Firms | Country | # of Jobs | |||||
| 1 | Germany | 251 | 1 | France | 26,568 | |||
| 2 | United Kingdom | 220 | 2 | Germany | 24,050 | |||
| 3 | Ireland | 164 | 3 | United Kingdom | 15,972 | |||
| 4 | Japan | 129 | 4 | Japan | 11,361 | |||
| 5 | France | 125 | 5 | Ireland | 7,856 | |||
| 6 | Canada | 78 | 6 | Luxembourg | 7,515 | |||
| 7 | Netherlands | 66 | 7 | Netherlands | 7,066 | |||
| 8 | Italy | 52 | 8 | Israel | 5,619 | |||
| 9 | Mexico | 45 | 9 | Canada | 4,982 | |||
| 10 | Sweden | 39 | 10 | Mexico | 4,189 |
(Source: Dun & Bradstreet, October 2023)
With foreign-owned firms using Pennsylvania as a center for production, distribution, and sales, such companies contribute significantly to both exports and imports. This and additional international trade is key to Pennsylvania’s engagement with economies around the world, working in conjunction with FDI to drive economic growth in the state. Export and import data for Pennsylvania is also available on BusinessPA’s website and includes the following:
- Exports account for over 5% of the state’s GDP
- Exports support around 1.6 million jobs in Pennsylvania
- Over $1 trillion in goods and services move through PA infrastructure each year
- Pennsylvania reaches customers in 209 countries and territories
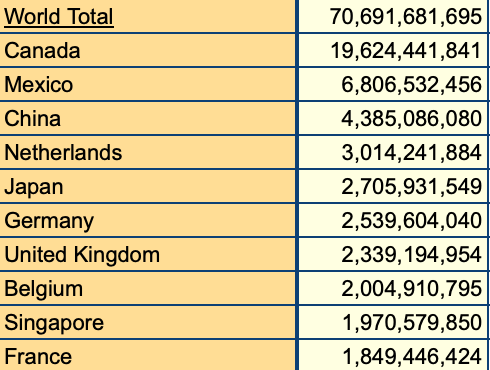
The most recent data revealing the state’s top export and import countries is available from USA Trade Online, an online data tool from the U.S. Census. It is worth noting that this data does not include export or import shipments under $2,500 that are not subject to other regulatory requirements, meaning that the values listed understate the total amount of trade that took place during the designated time period.
Top Countries by Exports from Pennsylvania, January 2024 through March 2025 (in $USD)
Top Countries by Increase in Exports from Pennsylvania, 2014 to 2024 (in % Change)
| World Total | 32.33% |
| Timor-Leste | 22368.23% |
| Cuba | 5594.44% |
| Solomon Islands | 4301.12% |
| Micronesia | 2438.03% |
| Tajikistan | 1775.90% |
| Albania | 1670.43% |
| Cote d’Ivoire | 1453.16% |
| Comoros | 1203.44% |
| Uzbekistan | 851.45% |
| French Guiana | 803.70% |
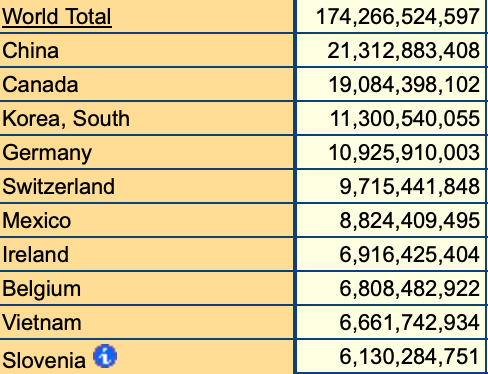
Top Countries by Imports to Pennsylvania, January 2024 through March 2025 (in $USD)
Top Countries by Increase in Imports to Pennsylvania, 2014 to 2024 (in % Change)
| World Total | 52.95% |
| Togo | 6026335.07% |
| Namibia | 80740.56% |
| Slovenia | 20528.46% |
| Zambia | 18846.48% |
| Mali | 15153.69% |
| New Caledonia | 14296.46% |
| Libya | 12894.97% |
| Seychelles | 11691.08% |
| Laos | 11686.76% |
| Albania | 11225.75% |
(Source: USA Trade Online, U.S. Census Bureau)
OIBD and the broader BusinessPA team have a variety of available resources for those interested in FDI or international trade based in Pennsylvania. According to BusinessPA’s website, these services include the following:
- Site Selection & Visits: Find and tour potential sites that fit business needs.
- Research & Data: Get detailed insights on available workforce, infrastructure, taxes, and more.
- Business Connections: Meet regional and local suppliers, economic development partners and elected officials.
- Financial Assistance: Explore grants, low-interest loans, tax credits, and other financial tools.
For more information, visit BusinessPA’s pages on FDI and international trade. Along with these resources, Pennsylvania’s Global Investment Representatives and Authorized Trade Representatives, each of whom serve a specific geographic area, are available to assist with FDI and exporting, respectively. Reflecting Pennsylvania’s commitment to global engagement, these resources ensure that Pennsylvania remains both economically competitive and deeply connected with markets around the world.

Harrisburg Trade Data Summary
June 6, 2025Posted by Nathan Book
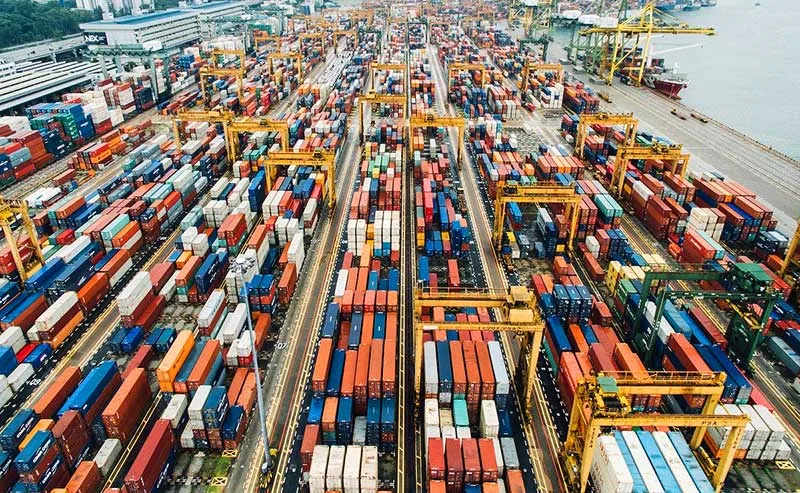
The city of Harrisburg is considered a strategic inland port due to its role as a hub for logistics and regional distribution. Boasting access to major interstate highways and rail lines and existing in close proximity to other major ports like New York, Philadelphia, and Baltimore, Harrisburg supports both domestic and international trade, with the latter fostered through the presence of Foreign-Trade Zone (FTZ) 147, which offers duty and customs advantages to businesses in the region. Additional information regarding FTZ 147 can be found here.
Recognizing the critical role of ports such as Harrisburg in stimulating trade, the Observatory of Economic Complexity (OEC) publishes export and import statistics at the port level, along with a broad range of trade data for countries and localities around the world. The OEC utilizes data visualization to make such statistics both accessible and understandable, drawing on sources such as the United Nations Commodity Trade Statistics Database as well as self-reported data from the U.S. Census Bureau and U.S. Customs and Border Protection, among other entities. As such, the data published by the OEC is expansive and is updated as new statistics become available.
The following data reflects Harrisburg’s trade activity from 2024:
- The city exported $18.1 million worth of goods and services, ranking it 238th out of the 387 U.S. ports for which export data was available.
- Its top exports were:
- Trailers and semi-trailers ($3.59 million)
- Telephones ($2.9 million)
- Electrical control boards ($2.15 million)
- Tanks and armored vehicles ($2 million)
- Electrical transformers ($1.02 million)
- The city imported $62.2 million in goods and services, ranking it 213th out of the 367 ports with available import data in the country.
- Its top imports were:
- Vaccines, blood, antisera, toxins, and cultures ($57.2 million)
- Medical instruments ($1.22 million)
- Leather footwear ($1.11 million)
- Aircraft parts ($1.05 million)
- Electrical control boards ($278 thousand)
- Overall, Harrisburg held a trade deficit of $44.1 million for the year.
In addition to these figures, the OEC releases data from the most recent month for which statistics are available. Though not reflective of Harrisburg’s overall trade due to seasonal fluctuations and irregular shipping schedules, such statistics are helpful in determining trends when compared to prior months. The following data for Harrisburg comes from April 2025:
- The city’s trade of goods and services amounted to $636 thousand in exports and $52 thousand in imports. The low amount of imports can largely be attributed to increased tariffs and a previous pre-tariff surge in imports.
- The city exported most to:
- Netherlands ($239 thousand)
- United Arab Emirates ($85.3 thousand)
- China ($37 thousand)
- Costa Rica ($34.6 thousand)
- Philippines ($33.1 thousand)
- This resulted in a trade surplus of $584 thousand for April.
The subsequent statistics compare Harrisburg’s trade data from April 2024 to April 2025:
- Harrisburg’s exports decreased by $24.3 thousand, while imports decreased by $161 thousand.
- This decrease was explained primarily by declines in annual exports for the following products:
- Electrical Control Boards (-$139 thousand)
- Insulated Wire (-$53 thousand)
- Broadcasting Equipment (-$36.3 thousand)
- Documents of Title (-$13.4 thousand)
- Low-Voltage Protection Equipment (-$10 thousand)
- The significant decrease in imports can largely be attributed to business and consumer responses to increased tariffs. In terms of specific goods, a notable decrease was evident in imports of leather footwear (-$137 thousand).
- Over this period, the countries experiencing the largest increase in exports from Harrisburg were China ($33.7 thousand), United Arab Emirates ($27.3 thousand), and Ireland ($23 thousand).
- In contrast, the nations or territories with the greatest decrease in exports from the city were Australia (-$21.6 thousand), Malaysia (-$12.5 thousand), and the Netherlands (-$9.8 thousand).
The OEC’s trade data for locations around the world can be found here. Pro and premium subscriptions are also available to gain access to additional statistics. This data serves as a valuable resource for understanding global and regional trade patterns, including those relevant to Harrisburg’s international trade activity. Access to detailed information can help businesses and organizations make more informed decisions based on the region’s export and import performance.
- 1
- 1-10 of 10 results