November Economic Indicators Update: International Trade
December 5, 2025Posted by Nathan Book
Each month, the U.S. Census Bureau publishes updated economic data, including detailed information on international trade. These updates show how goods and services move between the United States and global markets, offering a snapshot of demand for U.S. products, the performance of American industries overseas, and shifts in the nation’s trade balance. Due to the recent lapse in federal funding, the release of such statistics has been delayed. The figures below are drawn from the most recent release on November 19, reflecting trade activity from August 2025.
Exports for the nation totaled $280.8 billion, with $179.0 million of that being exports of goods and the remaining $101.8 billion being exports of services.
- This represents an overall increase of $0.2 billion from the previous month. This slight increase can be attributed to exports of services, which increased by $0.8 billion from July to August.
- This increase resulted in the highest ever monthly total for exports of services at $101.8 billion. Areas that experienced the most growth from July to August include travel (up $0.3 billion), maintenance and repair services (up $0.2 billion) and charges for the use of intellectual property (also up $0.2 billion).
- Exports of capital goods reached $62.4 billion, also constituting the highest monthly figure on record, after reaching a previous high in July. This figure was boosted by a notable increase in exports of computers (up $2.3 billion) as companies continue to invest in new technology and increase their utilization of artificial intelligence.
- Other goods and services categories that experienced notable change in exports from the previous month include pharmaceutical preparations (down $1.2 billion) and nonmonetary gold (down $1.1 billion).
The United States’ imports reached $340.4 billion, consisting of $264.6 billion in goods and $75.8 billion in services.
- Contrasting the trend from June to July, imports experienced a notable decrease ($18.4 billion) from July to August. This was primarily due to a $18.6 billion decrease in imports of goods, likely due to the effects of tariffs, as well as decreases in consumer demand in some areas.
- Imports of services for August were the highest monthly total on record, rising $0.3 billion from July and fueled by $0.1 billion increases in three categories: other business services, travel, and telecommunications, computer, and information services.
- Record high monthly totals were also reached with imports of other goods ($13.6 billion).
- Imports of consumer goods ($55.1 billion) fell to their lowest level since July 2020. This is likely due to the continued implementation of tariffs, as well as both businesses and consumers responding to price increases and associated economic uncertainty.
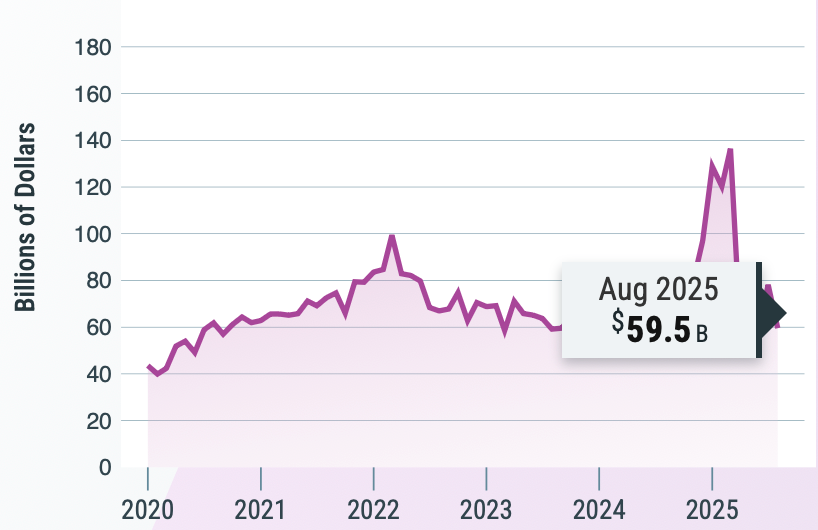
As such, the United States’ current international trade deficit is $59.6 billion, including a deficit of $85.6 billion in goods and a surplus of $26.1 billion in services.
- This deficit is $18.6 billion lower than it was in June, representing a decrease of 23.8 percent. The goods deficit was also the lowest monthly figure since September 2023.
The statistics from July also showed a combination of trade surpluses and deficits with various countries, demonstrating the varied nature of the United States’ economic relationships with other nations.
- The largest trade surpluses were evident with the Netherlands ($5.1 billion), South and Central America ($4.9 billion), and Hong Kong ($1.7 billion).
- Significant deficits were present with Mexico ($16.3 billion), China ($15.4 billion), Vietnam ($14.4 billion) and Taiwan ($12.2 billion).
- Imports from Canada for the month of August ($29.4 billion) were the lowest since May 2021 as the trade environment between the two countries becomes increasingly more challenging.
All trade figures are seasonally adjusted and reported in line with international accounting standards to capture the full flow of goods and services across U.S. borders. The date for the next release, featuring data from September, has not yet been named, but will be established in coordination with other federal agencies to adequately address the effects of the recent federal funding lapse.
U.S. Census Bureau. International Trade. U.S. Department of Commerce. Accessed December 2, 2025. https://www.census.gov/foreign-trade/Press-Release/current_press_release/ft900.pdf