Author: Tina Weyant
Bringing the World to PA 2025
October 3, 2025Posted by Nathan Book
On September 10, BusinessPA and World Trade Center Harrisburg hosted Bringing the World to Pennsylvania at the AACA Museum in Hershey. The annual event was one of ten stops held across the state from September 8–19, which connects local companies with the state’s network of Authorized Trade Representatives (ATRs) around the world. These ATRs work alongside Pennsylvania’s Regional Export Network (REN), which exists as PA’s in-state network of trade experts across 10 geographic regions, one of which is served by World Trade Center Harrisburg. Covering 44 countries worldwide, these 13 ATRs serve as Pennsylvania’s in-country experts, providing on-the-ground insight into market conditions, regulatory requirements, cultural considerations, and opportunities for companies looking to expand abroad. Their visit to Pennsylvania each fall gives businesses across the state the unique chance to meet face-to-face with these international trade professionals without leaving their home regions, making global expansion and investment from abroad possible and accessible to companies of all sizes.
This year’s event in Hershey brought together ATRs from markets across Europe, Asia, Oceania, the Middle East, and the Americas, as well as a diverse mix of southcentral Pennsylvania companies ranging from manufacturers to service providers. Throughout the day, companies met individually with ATRs to discuss export strategies, market-entry plans, and opportunities to grow their global presence. These one-on-one consultations were complemented by networking opportunities with peers and trade professionals, as well as a keynote address that underscored the importance of international trade to the economic vitality of both southcentral Pennsylvania and the U.S. as a whole.


The keynote address was delivered by David L. Cohen, who served as the U.S. ambassador to Canada during the Biden administration. Cohen’s speech was entitled “State of International Trade in Trump Administration Ⅱ” and shared both his experience working as U.S. ambassador to Canada and his insights regarding the current policy environment in the nation and their impacts on both the United States’ relationship with Canada and on its economy as a whole. He discussed the multifaceted role ambassadors play in managing geopolitical relationships and detailed Trump’s tariff announcements and their potential economic impacts, in addition to sharing how tariffs combined with spending cuts and tax hikes constitute the largest redistribution of wealth in American history. In spite of changes in priorities and policies between administrations, Cohen reiterated that what remains constant is Canada’s close economic ties with the United States, and more specifically, Pennsylvania.
By showcasing local companies and connecting them directly with Pennsylvania’s global representatives, Bringing the World to Pennsylvania highlighted the state’s commitment to supporting exporters, attracting foreign investment, and strengthening the state’s role in the international marketplace. The event not only reinforced the value of international engagement for businesses seeking growth but also demonstrated how state-level resources can help companies overcome barriers to entering foreign markets. Looking ahead, the insights shared and connections forged during the event will continue to shape the region’s participation in the global economy.
July Economic Indicators Update: International Trade
July 9, 2025Posted By Nathan Book
Each month, the U.S. Census Bureau publishes updated figures on numerous economic indicators, including those related to international trade. This data tracks the movement of goods and services into and out of the United States, offering a glimpse into global demand for American exports, the performance of domestic industries in global markets, and the nation’s overall trade balance. The statistics shared below appeared in the most recent report, dated July 3, which shared data from May 2025.
Exports for the nation totaled $279.0 billion, with $180.2 million of that being comprised of goods and the remaining $98.8 billion being imports of services.
- This represents an overall decrease of $11.6 billion, or around 4 percent, from the previous month, which can be attributed to a $10.8 billion decline in exports of goods.
- Petroleum exports ($19.0 billion) were the lowest since October 2021 as oil prices fell due to economic uncertainties resulting from new and anticipated U.S. tariffs. With oil production being less profitable due to these low prices, the U.S. produced and therefore exported less oil during the month of May.
- The broader category of industrial supplies and materials also experienced a decrease in exports, dropping $10.0 billion from April to May. This drop can largely be credited to a $5.5 billion decline in exports of nonmonetary gold.
- Exports of consumer goods ($22.4 billion) reached their highest point since March 2023, driven by a $1.1 billion increase in exports of pharmaceutical preparations from April to May. However, some of this high export value may be due to a temporary surge in exports as some businesses anticipate supply chain disruptions, increased input costs, or reduced demand due to tariffs.
The United States’ imports reached $350.5 billion, consisting of $277.7 billion in goods and $72.8 billion in services.
- A slight decline in imports ($0.3 billion) was evident from April to May, with both goods ($0.2 billion) and services ($0.1 billion) experiencing comparatively minor decreases in terms of their imports.
- Imports of industrial supplies and materials fell $0.9 billion from April to $51.1 billion, the lowest value since April 2021. This is somewhat due to decreases in imports of finished metal shapes, but can primarily be attributed to U.S. tariffs weighing on trade. This is particularly evident with industrial materials, which saw their imports largely front-loaded in anticipation of tariffs, resulting in a sharp plummet in May once tariffs came more into effect.
- Although most goods and services experienced a decrease in imports, some saw their imports rise from April to May, including passenger cars ($3.1 billion), computers ($4.4 billion), and nuclear fuel materials ($0.6 billion).
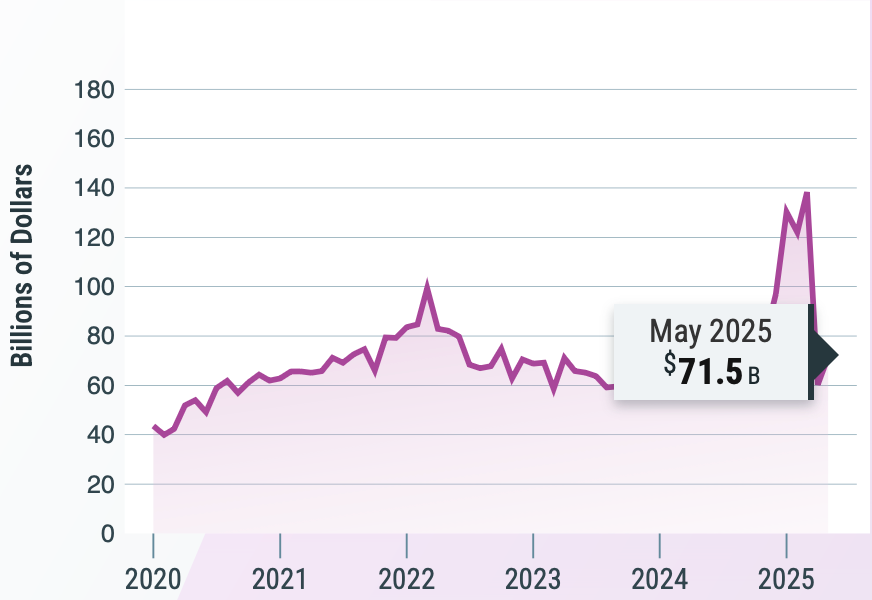
As such, the United States’ current international trade deficit is $71.5 billion, including a deficit of $97.5 billion in goods and a surplus of $26.0 billion in services.
- This deficit is $11.3 billion higher than it was in April, representing an increase of 18.7 percent, although it is worth noting that April’s trade deficit was the lowest since September 2023.
The statistics from May also demonstrated a combination of trade surpluses and deficits with various countries, reflecting the varied nature of the United States’ economic relationships with other nations.
- The largest trade surpluses were evident with the Netherlands ($4.8 billion), Hong Kong ($3.6 billion), South and Central America ($3.3 billion), and Switzerland ($3.3 billion). The May surplus with Switzerland was the highest ever recorded.
- Significant deficits were present with the European Union ($22.5 billion), Mexico ($17.1 billion), Vietnam ($14.9 billion), and China ($14.0 billion). The deficit with Vietnam, as well as that with Taiwan ($11.5 billion) and Thailand ($5.2 billion), were the highest on record.
- Notably, the U.S. trade deficit with China narrowed by $5.7 billion from April to May, fueled by a $7.4 billion decrease in U.S. imports of Chinese goods and services.
All trade data is seasonally adjusted and follows international accounting standards to show the complete movement of goods and services across U.S. borders. The upcoming release, which will present June’s statistics, is scheduled for August 5. Regular analysis of these reports aids in forecasting efforts and provides insight into both national economic conditions and global market trends.
U.S. Census Bureau. International Trade. U.S. Department of Commerce. Accessed July 8, 2025. https://www.census.gov/foreign-trade/Press-Release/current_press_release/ft900.pdf
JUNE ECONOMIC INDICATORS UPDATE: INTERNATIONAL TRADE
July 8, 2025Posted by Nathan Book
Each month, the U.S. Census Bureau releases national data on a variety of key economic indicators. Among these figures are several pertaining to international trade, measuring the flow of goods and services across U.S. borders. These statistics provide insights into global demand for American products, the competitiveness of U.S. industries, and the balance between what the nation sells abroad and what it buys from other countries. The following statistics were present in the most recent report, dated June 5, which shared data from April 2025:
- U.S. exports totaled $289.4 billion, with $190.5 billion being comprised of exports of goods and the remaining $98.9 billion in services exports.
- Exports of goods increased ($6.2 billion) from the previous month, fueled by a surge in exports of industrial supplies and materials.
- Exports of services experienced also increased ($2.1 billion) from March to April. The primary contributor to this increase was a rise in the export of travel services.
- Imports for the nation reached $351.0 billion. Among these imports were $277.9 billion in goods and $73.1 billion in services.
- Imports of goods experienced a notable decrease ($68.9 million) from the previous month, with decreases evident in all categories. Representing the largest ever monthly drop, this is largely a result of a surge in imports in March to avoid tariffs, followed by a pullback in April and businesses and consumers adjusted to new tariff policies.
- Imports of services also experienced a minimal increase ($0.5 billion) due to slightly higher imports of travel and other business services.
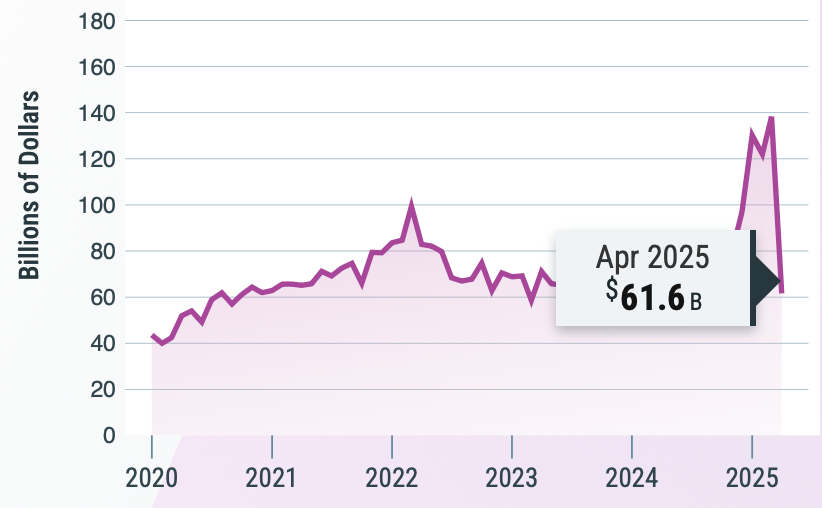
- As such, the United States’ current international trade deficit in goods and services is $61.6 billion, down $76.7 billion from March. This massive decrease can be attributed to a significant decrease in the imports of goods, brought upon by new and anticipated tariff policies. As shown by the graph below, this represents the nation’s lowest trade deficit since September 2023.
- With regard to trade with specific countries, the April statistics revealed a combination of surpluses and deficits, reflecting the varied nature of U.S. economic relationships around the world:
- Notable trade surpluses were recorded with Hong Kong ($6.9 billion), Netherlands ($4.8 billion), United Kingdom ($4.3 billion), and Switzerland ($3.5 billion).
- Deficits persisted with many key nations and regions, including China ($19.7 billion), the European Union ($17.9 billion), Vietnam ($14.5 billion), and Mexico ($13.5 billion).
All trade figures are adjusted to remove typical seasonal fluctuations and are reported using international accounting standards that track the full flow of goods and services between countries. The next iteration of data regarding these indicators, representing statistics from May, will be released on July 3. Monitoring these monthly statistics assists in the anticipation of market trends and prediction of performance in both domestic and global markets.
U.S. Census Bureau. International Trade. U.S. Department of Commerce. Accessed June 10, 2025. https://www.census.gov/foreign-trade/Press-Release/current_press_release/ft900.pdf
- 1
- 1-3 of 3 results